Ever wondered what’s really going on inside your Linux or macOS system at any given moment? Which processes are hogging your CPU? How much memory is being used? That’s where the venerable top command comes in. It’s a powerful, real-time system monitor that provides a dynamic view of running processes, system resources, and overall system performance. For system administrators, developers, and even curious users, top is an indispensable tool in the arsenal.
A Glimpse into the Past
Believe it or not, the concept of a real-time system monitor dates back several decades. While the exact origins of the top command are a bit hazy, it gained prominence in the Unix world. It evolved from simpler tools designed to display process information, gradually incorporating more detailed metrics about CPU utilization, memory consumption, and more. Over time, different Unix-like operating systems developed their own versions of top, leading to some variations in features and output. However, the core functionality – providing a dynamic, real-time view of system activity – has remained consistent.
Today, top is a standard utility found on virtually all Linux and macOS distributions. Its longevity speaks volumes about its utility and the fundamental need to understand what our systems are doing under the hood.
Understanding the top Output: A Guided Tour
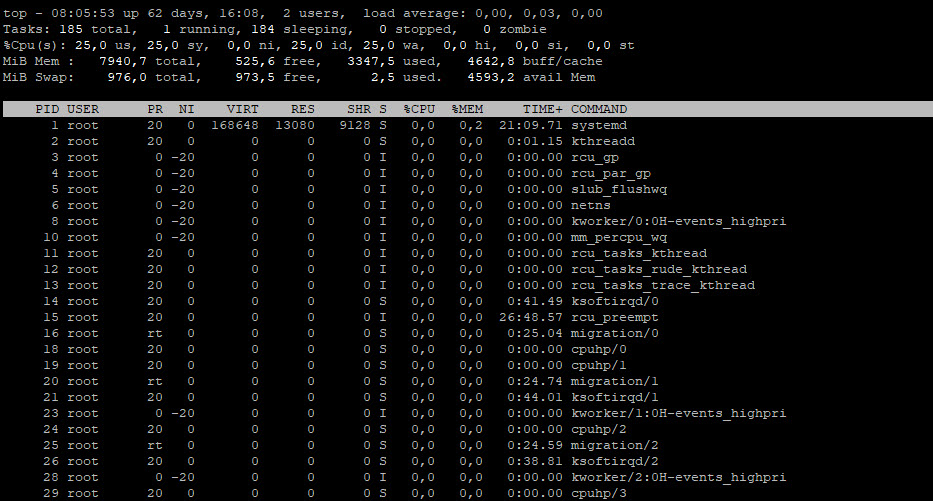
When you run top in your terminal, you’re greeted with a constantly updating display. Let’s break down the key sections:
The Header: This section provides a snapshot of the overall system status:
top - ...: Shows the current time, how long the system has been running (uptime), the number of users logged in, and the system load averages (representing the average number of processes in a runnable or uninterruptible state over the last 1, 5, and 15 minutes).Tasks: ...: Displays the total number of processes, along with their current states (running, sleeping, stopped, zombie).%Cpu(s): ...: Provides a breakdown of CPU utilization across different categories: user space (us), kernel space (sy), nice priority (ni), idle (id), wait for I/O (wa), hardware interrupt (hi), software interrupt (si), steal time (st), guest (guest), and guest nice (gn).Mem: ...: Shows information about physical memory usage, including total, used, free, active, and inactive memory.Swap: ...: Displays information about swap space usage, including total, used, and free swap.
The Process List: This is the heart of top, displaying information about individual processes:
PID: The unique Process ID.USER: The username of the process owner.PR: The process priority. Lower numbers indicate higher priority.NI: The “nice” value, which influences the process priority. Negative values increase priority, while positive values decrease it.VIRT: The total amount of virtual memory used by the process.RES: The resident memory size, which is the non-swapped physical memory the process is using.SHR: The amount of shared memory used by the process.S: The process status (e.g.,Sfor sleeping,Rfor running,Zfor zombie).%CPU: The percentage of CPU time the process is currently using.%MEM: The percentage of physical memory the process is using.TIME+: The total CPU time the process has accumulated since it started.COMMAND: The command that started the process.
Practical Examples: Seeing top in Action
Let’s look at some common scenarios where top proves invaluable:
1. Identifying CPU Hogs:
Imagine your system suddenly feels sluggish. Running top can quickly reveal which process is consuming the most CPU. Look at the %CPU column.
$ topYou might see an output like this (simplified):
top - 07:54:00 up 1 day, 1:23,  1 user,  load average: 0.12, 0.08, 0.05
Tasks: 187 total,   1 running, 186 sleeping,   0 stopped,   0 zombie
%Cpu(s):  2.3 us,  0.7 sy,  0.0 ni, 96.7 id,  0.2 wa,  0.0 hi,  0.1 si,  0.0 st
Mem:   8174984k total,  2345672k used,  5829312k free,   456780k buffers
Swap:  2097148k total,        0k used,  2097148k free.
  PID USER      PR  NI    VIRT    RES    SHR S  %CPU %MEM     TIME+ COMMAND
 1234 user      20   0 1567m  456m  234m R  85.6  5.6   2:15.34 intensive_task
 ...
In this example, the process with PID 1234 (intensive_task) is using a significant 85.6% of the CPU, likely causing the slowdown.
2. Monitoring Memory Usage:
If you suspect a memory leak or an application consuming excessive RAM, the %MEM column in top is your friend.
$ topLooking at the process list, you can see which applications have high values in the %MEM column. The Mem: section in the header also provides an overview of total, used, and free memory.
3. Observing System Load:
The load average in the header gives you a general idea of how busy your system is. A load average of 1.0 means the system is fully utilized.
Values significantly higher than the number of CPU cores might indicate performance bottlenecks.
4. Identifying Zombie Processes:
Zombie processes are defunct processes that have finished execution but their parent process hasn’t properly cleaned them up. They are usually marked with a Z in the S (status) column. While they don’t consume significant resources, a large number of zombie processes can indicate issues with application management.
Tips and Tricks to Master top
Beyond the basic usage, top offers several interactive commands and options to tailor the display and gain deeper insights:
- Sorting:
- Press
Pto sort processes by CPU usage (%CPU). - Press
Mto sort processes by memory usage (%MEM). - Press
Tto sort processes by CPU time (TIME+).
- Press
- Filtering:
- Press
ufollowed by a username to display only processes owned by that user. - Press
ofollowed by a field name and a filter condition to filter processes based on various criteria (e.g.,o COMMAND=apache2to see Apache processes).
- Press
- Changing Update Interval:
- Press
dfollowed by the desired interval in seconds (e.g.,d 2for a 2-second update).
- Press
- Killing Processes (Use with Caution!):
- Press
kfollowed by the PID of the process you want to terminate, and then the signal to send (usually9forSIGKILLto force termination). Be extremely careful when using this command as it can lead to data loss if used improperly.
- Press
- Displaying Full Command:
- Press
cto toggle the display of the full command line for each process.
- Press
- Customizing Fields:
- Press
fto select which fields are displayed in the process list. Use the arrow keys to navigate and the spacebar to toggle fields. Pressqto exit.
- Press
- Saving Configuration:
- Press
W(uppercase) to save your currenttopconfiguration to the~/.toprcfile, so your customizations are preserved across sessions.
- Press
- Using Command-Line Options:
top -n <number>: Exit after displaying<number>iterations.top -p <PID1>,<PID2>,...: Monitor only the specified PIDs.top -d <seconds>: Set the delay between updates.
Beyond top: Modern Alternatives
While top remains a powerful and widely available tool, several modern alternatives offer enhanced features and user interfaces:
htop: An interactive process viewer with color-coded output, improved sorting and filtering, and the ability to kill multiple processes at once. It’s often considered a more user-friendly alternative totop.glances: A cross-platform monitoring tool that provides a broader overview of system resources, including CPU, memory, network, disk I/O, and sensors. It can also be accessed via a web interface.vmstat: A command-line utility that reports virtual memory statistics. While not as interactive astop, it provides valuable insights into memory, swapping, CPU activity, and disk I/O.
Conclusion
The top command is a fundamental tool for understanding and managing your system’s performance in real time. Its rich feature set, combined with its ubiquity across Unix-like systems, makes it an essential skill for anyone working with these environments. By mastering the output and utilizing its interactive commands and options, you can gain valuable insights into your system’s inner workings and effectively troubleshoot performance issues. So, the next time your system feels a bit off, don’t forget to summon the power of top!