Have you ever wondered how much RAM your Linux system is actually using? Or perhaps how much is free and available for new applications? The free command is your go-to utility for getting a quick and clear snapshot of your system’s memory usage. It’s an essential tool for system administrators, developers, and even curious home users alike.
In this blog post, we’ll dive into the free command, explore its output, and look at some practical examples to help you better understand and manage your system’s memory.
What is the free command?
At its core, the free command displays the total amount of free and used physical memory and swap space in the system, as well as the buffers and caches used by the kernel. This information is crucial for diagnosing performance issues, ensuring your applications have enough resources, and generally keeping an eye on your system’s health.
The Basic Output of free
Let’s start by simply typing free in your terminal:
freeYou’ll likely see something similar to this (values will vary):
       total      used      free     shared  buff/cache  available
Mem:   16384000   8192000   4096000  1024000 4096000     7168000
Swap:  2048000    0         2048000
Let’s break down each column:
total: The total installed memory (physical RAM or swap space) on your system.used: The amount of memory currently being used by active processes and the kernel.free: The amount of memory that is completely unused and available immediately.shared: Memory that is shared between multiple processes. This often includestmpfs(temporary file systems in RAM).buff/cache: This is a crucial column that often causes confusion. It represents memory used by the kernel for disk buffers and page cache. This memory is not truly “used” in the sense that an application is actively consuming it. Instead, the kernel uses it to speed up disk I/O operations. When applications need more memory, the kernel can quickly free up thisbuff/cachememory.available: This is arguably the most important column for understanding how much memory is truly available for new applications without swapping. It estimates how much memory is available for starting new applications, without significant performance degradation. It takes into accountfreememory and a portion ofbuff/cachethat can be reclaimed.
And the rows:
Mem: Refers to your physical RAM.Swap: Refers to your swap space (a dedicated area on your hard drive used as virtual memory when RAM runs low).
Useful Options for free
The free command offers several options to make its output more readable and useful.
1. Human-Readable Output (-h)
The default output is in kilobytes, which can be hard to read for larger memory sizes. The -h (human-readable) option solves this by displaying values in KB, MB, or GB, whichever is most appropriate.
free -hOutput:
        total    used    free     shared    buff/cache   available
Mem:    15Gi     7.8Gi   3.9Gi    1.0Gi     3.9Gi        6.8Gi
Swap:   2.0Gi    0B      2.0Gi
Much easier to digest, right?
2. Display Total (-t)
The -t option displays a line showing the total of physical RAM and swap space.
free -t -hOutput:
         total     used      free    shared   buff/cache   available
Mem:     15Gi      7.8Gi     3.9Gi   1.0Gi    3.9Gi        6.8Gi
Swap:    2.0Gi     0B        2.0Gi
Total:   17Gi      7.8Gi     5.9Gi
This is useful for quickly seeing the combined memory resources.
3. Display in Megabytes or Gigabytes (-m, -g)
If you specifically want the output in megabytes or gigabytes, you can use -m or -g respectively.
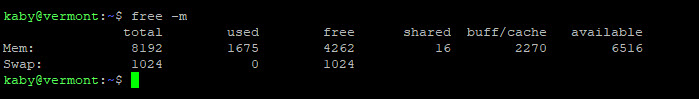
free -m   # Output in Megabytes
free -g   # Output in Gigabytes
4. Refreshing Output (-s <seconds>)
For continuous monitoring, the -s (seconds) option allows you to specify an update interval. This turns free into a live monitor.
free -h -s 5 # Update every 5 secondsPress Ctrl+C to stop the continuous output.
Understanding buff/cache and available
It’s common for new Linux users to see a small free memory value and assume their system is running out of RAM. However, this is often not the case due to how Linux manages memory with buff/cache.
Linux uses any unused RAM to cache disk operations. This makes subsequent access to those files much faster. This cached memory is listed under buff/cache. When an application needs more memory, the kernel will reduce the size of the buff/cache to make room for the application.
Therefore, the available column gives you a more accurate representation of how much memory is truly ready for new applications without impacting performance. If your available memory is consistently low, then you might have a memory pressure issue.
When to Worry About Memory
While seeing low free memory isn’t always a problem, here are some scenarios where you might need to investigate further:
- Consistently low
availablememory: Ifavailablememory is always near zero, your system might be struggling to allocate memory for new processes, leading to slow application launches or overall sluggishness. - High swap usage: If your
Swap“used” column is consistently high and increasing, your system is frequently resorting to using the slower swap space, which is a strong indicator of memory pressure. - Frequent OOM (Out Of Memory) killer activations: If you see messages in your system logs about the “OOM killer” terminating processes, it means your system has run out of memory and had to kill an application to free up resources.
Conclusion
The free command is a simple yet powerful tool for understanding your Linux system’s memory landscape. By understanding its output, especially the buff/cache and available columns, you can gain valuable insights into your system’s performance and make informed decisions about resource allocation. So, the next time you feel your system is sluggish, remember to fire up free and get a clear picture of its memory usage!