When working on Linux systems—whether servers, desktops, or containers—you eventually need to answer one question fast:
“What is my system doing right now?”
That’s where htop shines.
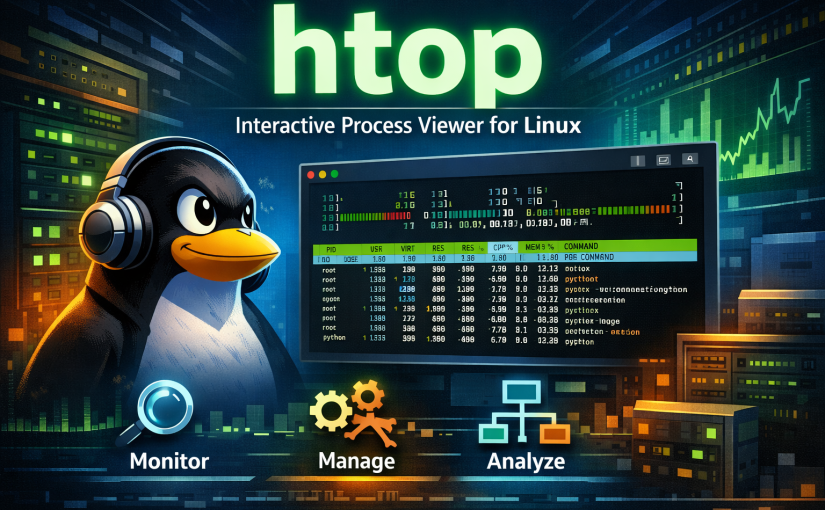
htop is an interactive, real-time process viewer for Linux. It improves upon the traditional top command with a clearer interface, mouse support, color-coded output, and powerful process management features. It’s lightweight, intuitive, and incredibly useful for both beginners and experienced system administrators.
In this article, we’ll explore:
- What
htopis - Why it’s better than
top - Its most useful features
- Practical use cases
- Pro tips for getting the most out of it
What Is htop?
htop is a terminal-based process monitoring tool that shows:
- CPU usage (per core)
- Memory and swap usage
- Running processes
- System load and uptime
Unlike top, htop is interactive by default—you don’t need to remember cryptic key combinations to make it useful.
Installing htop
Most Linux distributions include htop in their default repositories:
# Debian / Ubuntu
sudo apt install htop

# RHEL / Rocky / Alma
sudo dnf install htop

# Alpine
sudo apk add htop

# Arch Linux
sudo pacman -S htop
Once installed, simply run:
htopWhy Use htop Instead of top?
| Feature | top | htop |
|---|---|---|
| Color output | ❌ | ✅ |
| Mouse support | ❌ | ✅ |
| Tree view | ❌ | ✅ |
| Easy sorting | ❌ | ✅ |
| Kill processes interactively | ❌ | ✅ |
| Per-core CPU bars | ❌ | ✅ |
In short: htop shows more information in a way your brain processes faster.
Understanding the Interface
1. CPU, Memory, and Swap Bars
At the top of the screen:
- CPU bars show usage per core
- Memory bar shows RAM usage
- Swap bar shows swap utilization
Each bar is color-coded:
- Green: user processes
- Red: kernel/system usage
- Blue/Yellow: low-priority or I/O wait (varies by config)
This gives you instant system health insight.
2. Process List
The main window displays:
- Process ID (PID)
- User
- CPU usage
- Memory usage
- Command name
You can scroll, search, filter, and sort without stopping the process view.
3. Function Key Menu
At the bottom, common actions are clearly labeled:
| Key | Action |
|---|---|
| F3 | Search |
| F4 | Filter |
| F5 | Tree view |
| F6 | Sort |
| F9 | Kill |
| F10 | Quit |
No memorization required.
Most Useful Features of htop
🔍 Search and Filter
- F3: Search for a process name
- F4: Filter processes (e.g., show only
nginx)
Perfect when diagnosing a single misbehaving service.
🌳 Tree View (F5)
Shows parent–child relationships between processes.
When to use it:
- Debugging fork bombs
- Understanding service hierarchies
- Identifying which process spawned others
Example:
systemd
 └─ docker
    └─ containerd
       └─ python
⚡ Interactive Process Management
You can:
- Kill a process (
F9) - Change priority (nice value)
- Send specific signals (SIGTERM, SIGKILL, etc.)
All without leaving the interface.
📊 Sorting on the Fly (F6)
Sort processes by:
- CPU usage
- Memory usage
- Time
- PID
- User
This is invaluable when hunting:
- CPU hogs
- Memory leaks
- Runaway scripts
🖱 Mouse Support
If your terminal allows it, you can:
- Click to sort columns
- Select processes
- Scroll naturally
This makes htop surprisingly user-friendly—even for newcomers.
Practical Use Cases
✅ Troubleshooting High CPU Usage
Use htop when:
- A server feels slow
- Fans are spinning loudly
- Load averages spike
Sort by CPU and instantly identify the culprit.
✅ Diagnosing Memory Issues
Watch the memory bar and sort by memory usage to:
- Detect memory leaks
- Find applications consuming excessive RAM
- Verify container or VM limits
✅ Monitoring Servers in Production
htop is ideal for:
- SSH sessions
- Emergency diagnostics
- Quick health checks
It gives you actionable insight in seconds.
✅ Learning How Linux Works
For new Linux users, htop is educational:
- See how processes interact
- Understand load, memory, and priorities
- Observe real-time system behavior
Pro Tips for Power Users
🔧 Customize the Display
Press F2 (Setup) to:
- Enable/disable meters
- Add disk I/O or network meters
- Change color schemes
- Adjust refresh rates
You can tailor htop exactly to your workflow.
🧠 Combine with Other Tools
htop pairs well with:
iostat→ disk performancevmstat→ memory pressurejournalctl→ log analysis
Use htop to identify the problem, then drill deeper.
🚀 Use It Inside Containers
If installed inside a Docker container, htop helps you:
- Inspect resource usage
- Debug runaway processes
- Validate container limits
When Not to Use htop
- Automation → use
ps,top -b, or monitoring tools - Historical analysis → use Prometheus, Grafana, or logs
- Very minimal systems →
topmay be the only option
htop excels at interactive, real-time inspection.
Final Thoughts
htop is one of those tools that quickly becomes indispensable. Whether you’re managing production servers, running homelab infrastructure, or just learning Linux, it gives you immediate clarity into what your system is doing—and why.
If you only install one monitoring tool on a Linux system, make it htop.
Fast. Visual. Powerful.