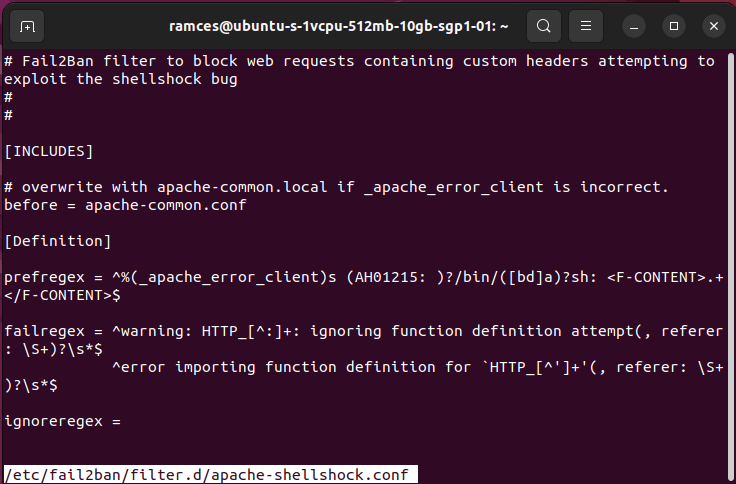
Unveiling Your Hardware: A Guide to lscpu, lsusb, lspci, and lsblk

As Linux users, understanding what’s under the hood of our systems is crucial for troubleshooting, performance optimization, and general curiosity. While graphical tools offer some insights, the command line provides a powerful and often more detailed view. Today, we’ll explore four essential commands that every Linux user should know: lscpu, lsusb, lspci, and lsblk.

Continue reading Unveiling Your Hardware: A Guide to lscpu, lsusb, lspci, and lsblk

Demystifying iostat: Your Go-To Tool for Storage Performance Insights

Ever wondered why your system feels sluggish, especially when dealing with disk-intensive tasks? Or perhaps you’re a system administrator trying to pinpoint a storage bottleneck. Look no further than the iostat command, a powerful utility available on most Linux and Unix-like systems that provides invaluable insights into your disk I/O performance.

Continue reading Demystifying iostat: Your Go-To Tool for Storage Performance Insights

Decoding System Health: Your Guide to the vmstat Linux Command

Is your Linux server feeling sluggish? Are applications taking longer to respond? Before you start tweaking obscure kernel parameters, one of the first places to look for clues is the vmstat command. Short for “virtual memory statistics,” vmstat is a powerful, built-in Linux utility that provides a quick, holistic view of your system’s performance, encompassing CPU, memory, I/O, and process activity.

Continue reading Decoding System Health: Your Guide to the vmstat Linux Command

Understanding Your System’s Memory with the Linux free Command

Have you ever wondered how much RAM your Linux system is actually using? Or perhaps how much is free and available for new applications? The free command is your go-to utility for getting a quick and clear snapshot of your system’s memory usage. It’s an essential tool for system administrators, developers, and even curious home users alike.

Continue reading Understanding Your System’s Memory with the Linux free Command

Diving Deep into top: Your Real-Time System Performance Dashboard

Ever wondered what’s really going on inside your Linux or macOS system at any given moment? Which processes are hogging your CPU? How much memory is being used? That’s where the venerable top command comes in. It’s a powerful, real-time system monitor that provides a dynamic view of running processes, system resources, and overall system performance. For system administrators, developers, and even curious users, top is an indispensable tool in the arsenal.

Continue reading Diving Deep into top: Your Real-Time System Performance Dashboard